
The FTSC fiscal year extends from September through August. The activities of the FTSC during a single fiscal year are described below. Please click here to view projects completed during additional fiscal years.
We have created an IMS using basic cartographic data for one park – Minuteman National Historic Site – and an IMS using additional, more complex data for the three parks – Vanderbilt Mansion National Historic Site, Home of FDR National Historic Site, and Eleanor Roosevelt National Historic Site. In addition, we created a simple IMS for the Boston Harbor Island National Park displaying the results of an invasive plant inventory. We feel these three IMS models demonstrate some of the obvious uses the Park Service may have for an IMS. The data displayed in Minuteman NHS may be useful to a park visitor interested in the bike trail, whereas the more detailed data and analysis found in the Roosevelt Vanderbilt NHS regarding inventorying and monitoring locations may be useful for park managers and field workers. The additional site, displaying the results of a specific project, serves as an efficient way for distant collaborators to view, interact with, and offer feedback on one aspect of the project. As outlined in the proposal, these IMS’s make use of the out-of-the-box capabilities available with the software; future IMS’s could be customized with significant changes in the presentation of the data.
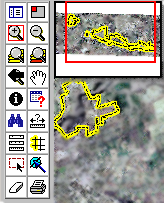
To introduce the non-GIS user into the world of digital maps, we have also created some simple introductory web pages. The website introducing the internet map servers and linking to them can be viewed at http://www.edc.uri.edu/ftsc/nps_ims/.
Created boundary of Blackstone River Valley using town boundary data from Massachusetts and Rhode Island. These data were reprojected to NAD 83 and FGDC compliant metadata were written for them.
GIS/GPS Support for BOHA:
Assessed horizontal accuracy for a recent orthophoto mosaic and vegetation map created for Boston Harbor Islands National Park Area. Accuracy was assessed on the basis of 73 field survey points distributed throughout the image. The actual field coordinates for these points (UTM Zone 19N, NAD 1983) were recorded with a Trimble GeoXT GPS unit with 120 fixes per point. Post-processed differential correction was performed in Pathfinder Office v.2.90 using correction files obtained from the GPS base station maintained by the Environmental Data Center in the University of Rhode Island's Department of Natural Resources Science (http://www.edc.uri.edu/gps/). With correction, data collected with this unit displays sub-meter accuracy. Data was delivered in ESRI shapefile format.
GPS support was also provided for ongoing natural resource projects conducted by Ted Elliman at Boston Harbor Islands. Deliverables included un-processed data downloaded from the park’s Trimble GeoExplorer 3 GPS unit.
NPS Boston Harbor Island’s Invasive Plant Species Study:
Our participation in the National Park Service’s Boston Harbor Island’s Invasive Plant Species Study began in September 2004 and continued through 2006. When we began working on this project, some field work had already been completed. For those islands not yet surveyed, our first task was to create draft maps that could be used in the field. We also assisted in teaching BOHA staff how to use and build a field library in the Trimble Geoexplorer3.
We received GPS data from the park in shape file format and proceeded to differentially correct the data using GPS Pathfinder Office 2.90 and base stations Coop_Cors, Environmental Data Center, University of Rhode Island, RI and Cors, Newport Base. Once all the points had been created, we reselected each point per island, creating twenty-five shapefiles, named by island. We also received Excel spreadsheets from the park containing percent coverage and frequency data of each species per island and the presence of each species at each plot per island. We converted these spreadsheets into tables using Microsoft Access, reversing the rows and columns to be more compatible for the database. We also created a table standard which contained a basic structure for all attribute fields within a geodatabase.
We found the X, Y coordinates of all of the points using the Field Calculator dialog: [Shape].Get X and [Shape].Get Y, within ArcMap 9.0. Then we joined the standard access table to the shapefile of points and coordinates and exported the results to a Geodatabase. We then assigned domains to the fields created in the standard table, making data entry easier. After completing data entry we joined the complete point dataset with the frequency tables and percent coverage tables (created in access) then exported the results to a shapefile (per request of the park). The join tool renamed the attribute field names, we used the ET Geowizard 9.2 “rename” tool to rename each field.
Once the shapefiles were complete we created metadata using the National Park Service Metadata Extension. We used the Integrated Taxonomic Information System (ITIS) website (http://www.itis.usda.gov) to build a Federal Geographic Data Committee (FGDC) Biological Profile Report for the taxonomy section of the metadata. Upon completion we used the NPS Metadata Tool “Metadata Parser (MP)” to generate the metadata to XML files, then ran the NPS Metadata Spell check tool.
Mapped Species Include:
Trees
Norway maple (Acer platanoides) ACPL
Sycamore maple (Acer pseudoplatanus) ACPS
Tree-of-heaven (Ailanthus altissima) AIAL
White poplar (Populus alba) POAL
English oak (Quercus robur) QURO
Shrubs
Japanese barberry (Berberis thunbergii) BETH
Oriental bittersweet (Celastrus orbiculata) CEOR
Morrow’s honeysuckle (Lonicera morrowii) LOMO
Glossy buckthorn (Rhamnus frangula) RHFR
Multiflora rose (Rosa multiflora) ROMU
Herbaceous plants
Common mugwort (Artemisia vulgaris) ARVU
Bassia (Bassia hirsuta) BAHI
Pigweed (Chenopodium album) CHAL
Broad-leaved pepperweed (Lepidium latifolium) LELA
Phragmites (Phragmites australis) PHAU
We worked closesly with Mark Adams at CACO on an RTK GPS and LiDAR project. Products included field-collected RTK datasets for East Harbor (Pilgrim Lake) and Pamet River, beach profiles of Marindin transects, a Lidar Data Review and Analysis of available data for Cape Cod (written report), a high resolution DEM for the Pamet watershed with FGDC-compliant metadata, and an Excel spreadsheet of beach profile data of Marindin transects extracted from the 2000 LiDAR data. All data sets were submitted only to Mark Adams. RTK data were collected over the span of four field trips to Cape Cod.
We visually inspected land parcel data and corresponding Real Property Service data within Fire Island National Seashore to assess the extent of potential errors present in the land parcel data. Discrepancies may be attributed to more than one cause; most errors are attributable to natural changes in coastline, digitizing errors, poor georeferencing, and other unknown causes. We have highlighted examples of some obvious discrepancies in the linked map: http://www.edc.uri.edu/ftsc/fiis/FIIS-parcels.pdf
Whatever the cause of the errors, more information is needed to resolve any of the problems. Acquiring the most recent versions of the data would be the first place to start; many discrepancies may have already been resolved in updated versions of the data. New geographic reference points with known accuracy are needed to fix instances of poor georeferencing, and would hopefully fix most of the errors where data appears to be ‘shifted’. Errors in digitizing may be simplest to fix if we are able to confirm that property boundaries do not cross into public roads.

Each year the NER GIS Program sponsors a Global Positioning System Swat Team to map something special in a national park. The SWAT Team collects locational and attribute data on everything from trails to rare lichens to archaeological sites and have even, on one occasion, mapped a kitchen sink location! The essence of the GPS Swat Team is that we spend a short time in the park, collect data as specified by the park staff, and provide completed digital map layers ready for use in GIS. While we prioritize for data collection projects that contribute to a specific project or base dataset, we will, in truth, map just about anything we can find in the field. In Spring 2004, students from the URI course NRS 522, "Advanced Techniques in Spatial Analysis", travelled to MAVA to collect an array of archeological data with the aid and direction of Nigel Shaw and Jim Harmon. Final data sets were reviewed by Jim and Nigel. Final copies of the data were supplied to Roland Duhaime, Nigel Shaw, and Jim Harmon.