
The FTSC fiscal year extends from September through August. The activities of the FTSC during a single fiscal year are described below. Please click here to view projects completed during additional fiscal years.
The FTSC at URI participating in the development of Natural Resource Condition Assessments (NRCA) for Acadia National Park (ACAD), Fire Island National Seashore (FIIS), Sagamore Hill National Historic Site (SAHI), and Gateway National Recreation Area (GATE). The goal of the Natural Reource Condition Assessment program is to determine the status of park resources, to identify knowledge gaps, and to make recommendations for futher studies that address threats to these resources. Development of NRCAs for ACAD, FIIS, SAHI, and GATE is ongoing collaborative effort involving researchers and GIS professionals from the University of Maine, Stony Brook University, the Univeristy of Rhode Island, and NPS staff from the New England Region.
Personnel from the FTSC have participated in numerous site visits and meetings, offering technical perspective on upcoming research and highlighting the need for quality data and metadata. We assessed the current status of park GIS databases and identified possible gaps in the available data.
To equip researchers at the parks, we have developed GIS databases for each park. Data for these databases were obtained from existing park databases as well as from the Inventory and Monitoring Program. Once existing data were assembled, data were mined from external databases, including the New York GIS Clearinghouse and other sources. The database structure used for ACAD was determined to be the most useful structure, and we have used it to store data for all four parks.
Many legacy datasets predate FGDC metadata standards. When possible, metadata were imported into the datasets. Datasets without metadata were given a template dataset, warning the user of possible problems and providing the user with basic information about the dataset, such as the projection and the contact for the Data Steward of the relevant park.
The Python Script Creator for Batch Processing Version 1.0 is a prototype of what can be done with just one of the ArcGIS Geoprocessing commands using Python Scripts. The example script converts multiple image files (.tif, or .img) to multiple GRIDS. The original idea was based on the need to batch process many of the functions in ArcGIS. However, Model Builder currently lacks batch geoprocessing, and coding in Python can be a significant hurdle for some. We tested a prototype Python Script in ArcGIS 9.1 with Python 2.1 installed, and it continues to work. So feel free to pass it along. With a bit more coding, there are hundreds of others that could be added or similar pages could be developed. To use this Python script creator in ArcGIS 9.2 (click here). For additional Python script creators, see FTSC Projects page for Fiscal Year 2006-2007.
During the spring of 2006, Nigel Shaw and Michael Bradley led a group of University of Rhode Island students in the collection of GPS data at Saratoga National Historical Park (SARA). The GPS Swat Team trip was conducted as part of the course, Application of GeoSpatial Tools (NRS-524), which was co-taught by Mike and Nigel. Coursework for NRS-524 included GPS theory and tutorials as well as hands on training with Trimble GPS units. Data collected at SARA included roads, culverts, wetlands, paths, picnic areas, monuments, overlooks, gravestones, trees, and other historical features specific to Saratoga. Knowledgeable NPS staff assisted with field identification of historical features. Data were post-processed, quality checked, and migrated to GIS format. All data have FGDC-compliant metadata.
The Global Positioning System Swat Team is sponsored annually by the NER GIS Program to map features in a national park. The SWAT Team collects locational and attribute data on everything from trails to rare lichens to archaeological sites and have even, on one occasion, mapped a kitchen sink location! The essence of the GPS Swat Team is that we spend a short time in the park, collect data as specified by the park staff, and provide completed digital map layers ready for use in GIS. While we prioritize for data collection projects that contribute to a specific project or base dataset, we will, in truth, map just about anything we can find in the field.
The National Park Service (NPS) has developed a standard for modeling buildings located in National Park Service lands within a Geographic Information System (GIS). Historically coverages and shapefiles have been used to represent the locations of building footprints; however, these legacy formats have limitations when dealing with large or robust datasets. The new NPS Buildings data standard uses a geodatabase format to address these limitations. The NPS Buildings data standard facilitates meaningful building geometry storage and flexible feature attributes, integrates with external NPS facility and structure management systems, and interchanges with national efforts. The geodatabase structure allows for multiple relationships to be established between tables and features. Buildings can be represented as both points and polygons for more advanced cartographic analysis and organization potential across the NPS. Parks can create their building footprints and assign unique ID values, independent of any particular external databases. These unique identifiers allow parks to add their building footprint data to federal databases or share them with other parks without encountering conflicts between features.
This geodatabase structure can be thought of as having two components: a tabular component, and a spatial component. The spatial component is divided into two feature classes: polygons and points. Each of the feature classes can be divided into multiple subtypes. For example, a single building may be defined by the centroid of the building footprint or by the entrance point. Either or both of these points can be used within the data model. In addition, the building may also be represented by a building footprint (Perimeter_Polygon), or by an area that extends beyond the building footprint (Buffer_Polygon). The tabular component is centered on an NPS_Building table that relates the spatial data with the tabular data. This table structure allows for more rapid data entry and better error checking than previous data models. It is believed that this standardized approach to a data format will serve as a model for the future development of geo-spatial data standards within NPS. A more detailed explanation of the data model can be found here: http://science.nature.nps.gov/nrdata/metadata.cfm?ID=38714
Our NER FTSC office edited documents that detail the process of converting legacy GIS data into this Geodatabase standard. This conversion is a multi-step process requiring the use of both ArcCatalog and ArcMap. The NER FTSC continues to participate in meetings and provide comments as the building model continues to be developed. As part of this effort, we were invited to participate as a member of the Building Standards Committee in the Buildings Standards and Implementation Workshop, Sept. 25-27, 2006 in Lakewood, CO, with NPS GIS technical experts.

As a part of the National Wild and Scenic Rivers System, the first 73.4 miles of the Delaware River are protected as the Upper Delaware Scenic and Recreational River (UPSRR), under the management of the National Park Service (NPS). UDSRR is visited by approximately 225,000 people per year primarily for recreational purposes to enjoy the pristine river and scenic vistas the river valley provides. In conjunction with providing outstanding family recreation opportunities the river provides exceptional habitat for a great variety of fish, endangered species such as Bald Eagles and dwarf wedge mussels, as well as drinking water for over 17 million people. The US Route 97 Scenic Byway also follows the river corridor.
New York Regional Interconnect, Inc. (NYRI) has proposed to build a 190-mile high-voltage direct current (HVDC) transmission line from Oneida County, New York to Orange County, New York. There are two possible routes for the power lines: a preferred route and an alternate route.
The goal of this project is to generate a viewshed analysis to identify the impacts of the proposed powerline on the scenic resources along the Upper Delaware River Valley. The analysis will allow the National Park Service (NPS) to
- Identify the extent of the proposed powerline visible from the Delaware River Valley along the preferred route
- Provide a viewshed analysis that addresses realistic elevation and vegetation changes
- Determine visual impacts on the natural scenery enjoyed by canoers, birders, fishermen, motorists, and countless others throughout the year
- Address the impacts of the alternate route for future reference
These objectives will be achieved jointly by the University of Rhode Island and the National Park Service. This work will utilize digital elevation models, vegetation data including vegetation heights, locations of observation points along the river corridor, and other GIS datasets. The final product of this project will be a series of viewshed spatial outputs addressing the visual impacts posed by the construction of the NYRI powerline along their proposed and alternate routes in the Delaware River Valley. These outputs can then be used by the NPS to produce a written report as well as a series of maps for display, and a powerpoint presentation on the visual impacts. URI staff will provide technical advice in the production of final report. This report will support the efforts of the National Park Service to address impacts of the proposed powerline.
In September 2004, we began working on the National Park Service’s Boston Harbor Island’s Invasive Plant Species Study. Some field work had already been completed. For those islands not yet surveyed, our first task was to create draft maps that could be used in the field. We also assisted in teaching BOHA staff how to use and build a field library in the Trimble Geoexplorer3.
We received GPS data from the park in shape file format and proceeded to differentially correct the data using GPS Pathfinder Office 2.90 and base stations Coop_Cors, Environmental Data Center, University of Rhode Island, RI and Cors, Newport Base. Once all the points had been created, we reselected each point per island, creating twenty-five shapefiles, named by island. We also received Excel spreadsheets from the park containing percent coverage and frequency data of each species per island and the presence of each species at each plot per island. We converted these spreadsheets into tables using Microsoft Access, reversing the rows and columns to be more compatible for the database. We also created a table standard which contained a basic structure for all attribute fields within a geodatabase.
We found the X, Y coordinates of all of the points using the Field Calculator dialog: [Shape].Get X and [Shape].Get Y, within ArcMap 9.0. Then we joined the standard access table to the shapefile of points and coordinates and exported the results to a Geodatabase. We then assigned domains to the fields created in the standard table, making data entry easier. After completing data entry we joined the complete point dataset with the frequency tables and percent coverage tables (created in access) then exported the results to a shapefile (per request of the park). The join tool renamed the attribute field names, we used the ET Geowizard 9.2 “rename” tool to rename each field.
Once the shapefiles were complete we created metadata using the National Park Service Metadata Extension. We used the Integrated Taxonomic Information System (ITIS) website (http://www.itis.usda.gov) to build a Federal Geographic Data Committee (FGDC) Biological Profile Report for the taxonomy section of the metadata. Upon completion we used the NPS Metadata Tool “Metadata Parser (MP)” to generate the metadata to XML files, then ran the NPS Metadata Spell check tool.
Mapped Species Include:
Trees
Norway maple (Acer platanoides) ACPL
Sycamore maple (Acer pseudoplatanus) ACPS
Tree-of-heaven (Ailanthus altissima) AIAL
White poplar (Populus alba) POAL
English oak (Quercus robur) QURO
Shrubs
Japanese barberry (Berberis thunbergii) BETH
Oriental bittersweet (Celastrus orbiculata) CEOR
Morrow’s honeysuckle (Lonicera morrowii) LOMO
Glossy buckthorn (Rhamnus frangula) RHFR
Multiflora rose (Rosa multiflora) ROMU
Herbaceous plants
Common mugwort (Artemisia vulgaris) ARVU
Bassia (Bassia hirsuta) BAHI
Pigweed (Chenopodium album) CHAL
Broad-leaved pepperweed (Lepidium latifolium) LELA
Phragmites (Phragmites australis) PHAU
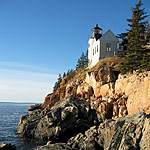
We created a TIN of Bar Harbor, ME for Acadia National Park. This work involved writing Python scripts, writing FGDC-compliant metadata, and processing large volumes of data to process ASCII data files delivered by a contractor for Bar Harbor, ME.
Traveled to two parks, Martin Van Buren National Historic Site (MAVA) and the Roosevelt-Vanderbilt National Historic Sites (ROVA), to interview park staff and determine their needs in the contxt of NPS enterprise and internet technology. These parks were selected to represent a small and a large park within the Northeast Region. At MAVA, some applicaitons of GIS at the park include future work on a General Management Plan, maps of regular maintenance activities, comparisons of historical and present-day conditions at the park, and monitoring of sensitive archaeological resources. At ROVA, some applicaitons of GIS include monitoring of invasive plant species, creation of maps for public meetings and local organizations, organization of special events on the property, and future work on a General Management Plan.